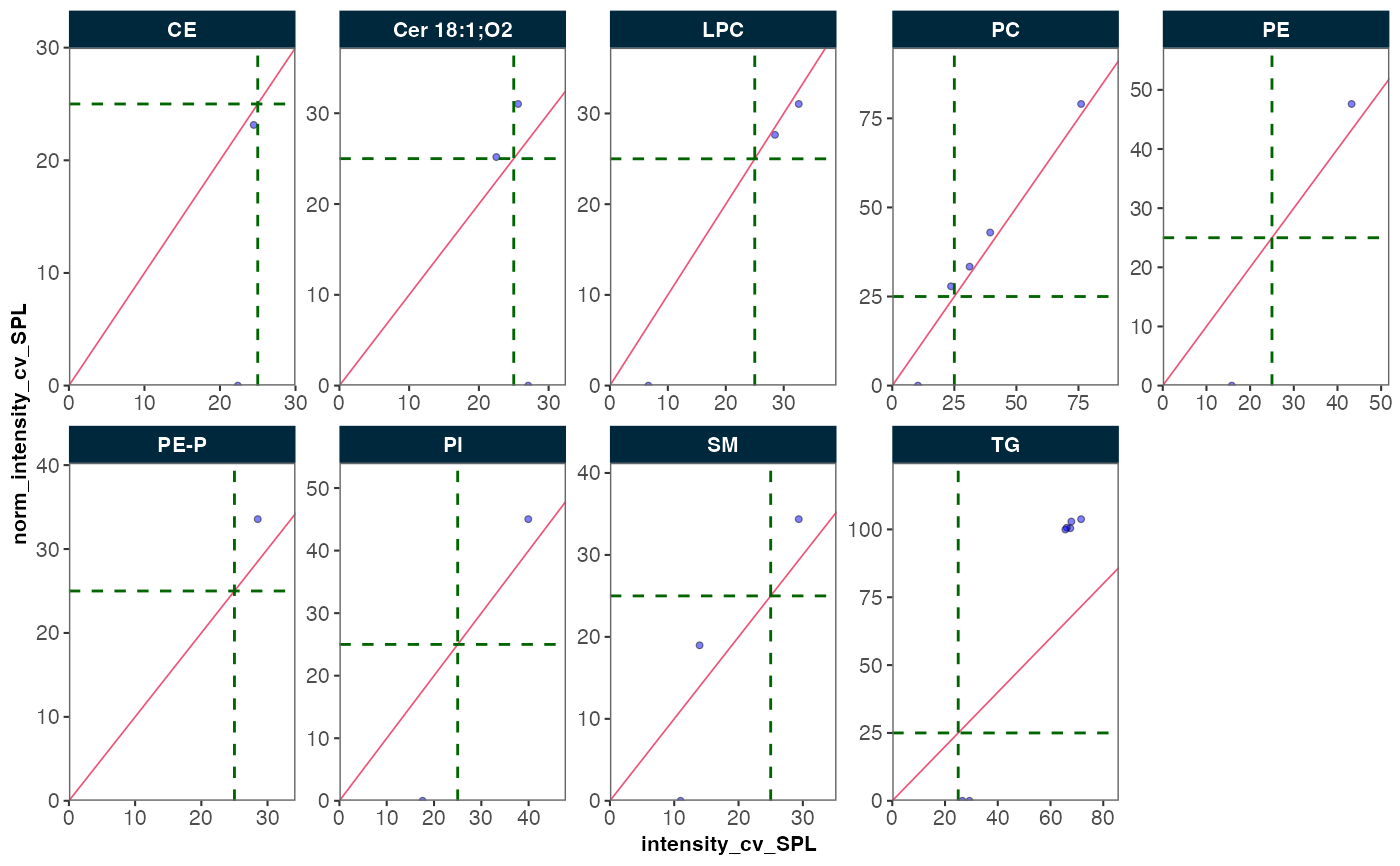
This function compares the coefficient of variation (CV) of QC or study
samples before and after normalization. It preselects the relevant QC metrics
based on the chosen arguments and visualizes the comparison through a scatter
plot. The plot can be faceted by feature_class.
Usage
plot_normalization_qc(
  data = NULL,
  before_norm_var = c("intensity", "norm_intensity", "conc_raw"),
  after_norm_var = c("norm_intensity", "conc", "conc_raw"),
  qc_types,
  facet_by_class = FALSE,
  filter_data = FALSE,
  include_qualifier = FALSE,
  cv_threshold_value = 25,
  xlim = c(0, NA),
  ylim = c(0, NA),
  cols_page = 5,
  point_size = 1,
  point_alpha = 0.5,
  font_base_size = 8
)
Arguments
- data
A
MidarExperimentobject- before_norm_var
A string specifying the variable from the QC metrics table to be used for the x-axis (before normalization).
- after_norm_var
A string specifying the variable from the QC metrics table to be used for the y-axis (after normalization).
- qc_types
A character vector specifying the QC types to plot. It must contain at least one element. The default is
NA, which means any of the non-blank QC types ("SPL", "TQC", "BQC", "HQC", "MQC", "LQC", "NIST", "LTR") will be plotted if present in the dataset.- facet_by_class
If
TRUE, facets the plot byfeature_class, as defined in the feature metadata.- filter_data
Whether to use all data (default) or only QC-filtered data (filtered via
filter_features_qc()).- include_qualifier
Whether to include qualifier features (default is
TRUE).- cv_threshold_value
Numerical threshold value to be shown as dashed lines in the plot (default is
25).- xlim
Numeric vector of length 2 for x-axis limits. Use
NAfor auto-scaling (default isc(0, NA)).- ylim
Numeric vector of length 2 for y-axis limits. Use
NAfor auto-scaling (default isc(0, NA)).- cols_page
Number of facet columns per page, representing different feature classes (default is
5). Only used iffacet_by_class = TRUE.- point_size
Size of points in millimeters (default is
1).- point_alpha
Transparency of points (default is
0.5).- font_base_size
Base font size in points (default is
8).
Value
A ggplot2 object representing the scatter plot comparing CV values
before and after normalization.
Details
The function preselects the corresponding variables from the QC metrics and uses
plot_qcmetrics_comparison() to visualize the results.
The data must be normalized before using
normalize_by_istd()followed by calculation of the QC metrics table viacalc_qc_metrics()orfilter_features_qc(), see examples below.When
facet_by_class = TRUE, then thefeature_classmust be defined in the metadata or retrieved via specific functions, e.g.,parse_lipid_feature_names().
Examples
# Example usage:
mexp <- lipidomics_dataset
mexp <- normalize_by_istd(mexp)
#> ! Interfering features defined in metadata, but no correction was applied. Use `correct_interferences()` to correct.
#> ✔ 20 features normalized with 9 ISTDs in 499 analyses.
mexp <- calc_qc_metrics(mexp)
plot_normalization_qc(
  data = mexp,
  before_norm_var = "intensity",
  after_norm_var = "norm_intensity",
  qc_type = "SPL",
  filter_data = FALSE,
  facet_by_class = TRUE,
  cv_threshold_value = 25
)