Quick Start
Setting up a new peak integration project with MRMhub-INTEGRATOR
This short tutorial presents the steps to create a basic peak integration project. Input files are prepared, the integration run, and result inspected and integration refined.
Every INTEGRATOR release offers a demo download with a complete demonstration dataset, raw data (.mzML) together with all required input files (see the Demo). It is the quickest way to obtain working files: run it directly as ready-made test data to follow the steps below, or copy its input files as templates when setting up a new analysis.
1. Convert the raw files to mzML
INTEGRATOR requires MS raw data in the open mzML format. Native vendor files (e.g. Thermo .raw, SCIEX .wiff, Agilent .d) must first be converted with ProteoWizard MSConvert (Windows only), which needs to be done only once per dataset → mzML conversion.
2. Set up the project
A project is a single, self-contained folder holding the executable, input files, raw data, and results, keeping the full analysis and dataset transferable and reproducible. Assemble it as follows; see Installing MRMhub-INTEGRATOR for obtaining INTEGRATOR, the first-launch security prompt, and the full project layout.
- Create the project folder and move the
.mzMLfiles into a subfolder (e.g.,mzML/). - Add the INTEGRATOR tools — the executables and the plotting script, from a release or an existing project.
- Add the input templates — the template
param.txt,run_order.csv, andfeature_list.csvbundled in a release, or copied from an existing project.
my-project/
├── MRMhub.exe / .app      ← peak-integration executable
├── MRMhub-viz.exe / .app  ← visualiser (optional)
├── MRMhub_plot.r          ← R script for creating chromatogram PDFs
├── mzML/                  ← the .mzML files
├── param.txt          ┐
├── run_order.csv      ├  input templates (step 3)
└── feature_list.csv   ┘
Project folder layout prior to integration
3. Prepare the input files
Edit and review the input files that configure the peak integration run — one global, and two defining the samples and the features. See the Input Files reference for a description of all parameters.
| File | Configuration |
|---|---|
param.txt |
Name and location of the input and mzML files, the global peak-detection and border-finding settings, and the RT-shift correction parameters. Must be in the same folder as the MRMhub executable. |
run_order.csv |
The mzML files to process, listed in run order, optionally, the reference sample(s) for RT-shift estimation. sample_type is optional, with only blanks (BLK) being treated specially |
feature_list.csv |
Transition precursor and product m/z values, transition and feature identifiers, the expected feature RT, optional per-feature integration settings. |
4. Run INTEGRATOR
INTEGRATOR is launched from the project folder and its terminal menu is worked through in order; see Processing Workflow for the full reference. It is started by double-clicking MRMhub (macOS) or MRMhub.exe (Windows), or from a terminal opened in the project folder.
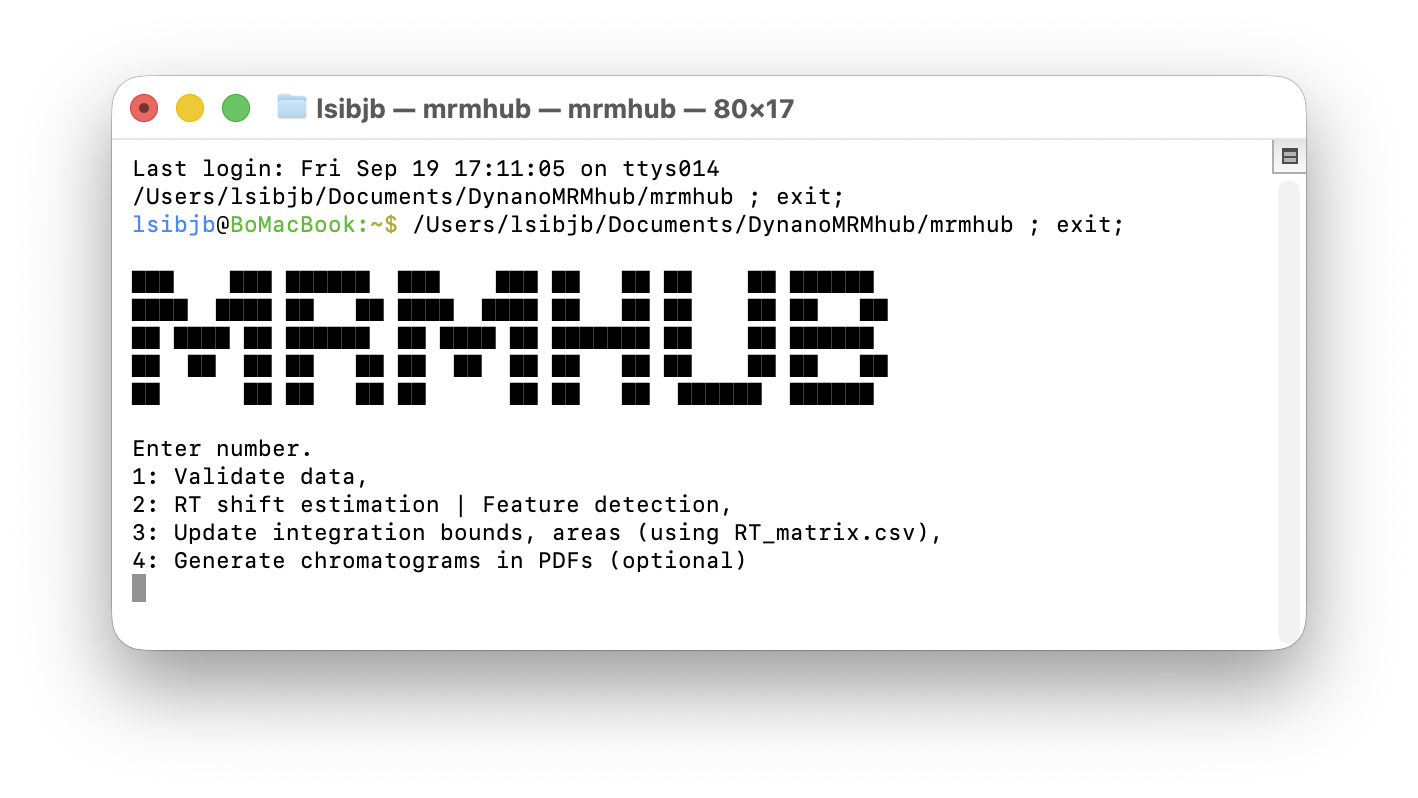
- Data Validation — the input files are loaded and checked for inconsistencies (mzML files or transitions that are listed but missing, or present but unlisted). Report files are written only if problems are found (see file tree below)
- Peak Finding & RT-shift estimation — peaks are detected and the retention-time shift across the sequence is estimated. Produces
RT_matrix.csv(the detected peaks with their per-sample integration borders), which is required for step 3. - Peak Integration — the peaks from step 2 are integrated. Produces
long.csv(the canonical hand-off to QUANT),quant_raw.csv(wide-format peak areas), and themisc/folder (binary results used by MRMhub-viz and step 4). - Generate PDF results (optional) — the integrated chromatograms are plotted as PDFs, grouped into
by_transition/,by_transition_low/, andby_sample/.
The steps run in order, each using the previous one’s output (steps 1–3 for a new dataset; step 4 optional). The application can be closed and reopened between steps — intermediate files persist, so the run can be resumed. Editing any input file, however, requires restarting from step 1. The run adds these outputs to the project folder:
my-project/
├── missing_files.txt     ┐
├── missing_compounds.txt ├ step 1: validation reports (only if problems found)
├── missing_details.txt   ┘
├── RT_matrix.csv         ← step 2: peaks + per-sample borders
├── long.csv              ← step 3: long-format integration results table
├── quant_raw.csv         ← step 3: wide-format peak areas
├── misc/                 ← step 3: binary results (used for MRMhub-viz)
├── by_transition/        ┐
├── by_transition_low/    ├ step 4 (optional): chromatogram PDFs
├── by_sample/            ┘
└── …                     ← executable, mzML/, input files (unchanged)
Files and folders added by the run, each annotated with the step that creates it
On first launch after download the operating system shows a one-time security prompt (macOS Gatekeeper / Windows “Unblock”). See clearing the security prompt.
5. Review the results
The chromatograms and peak integration results can be reviewed in either of two ways:
- From the PDFs (if step 4 was run) — the per-transition and per-sample PDFs can be browsed quickly with a file previewer: macOS Quick Look (press Space) or the Windows File Explorer preview pane, switching transitions with the arrow keys and scrolling with the mouse wheel.
- Interactively in the MRMhub-viz app — results are examined feature by feature. → MRMhub-viz
Guided by the review, the global and per-feature settings can be refined and INTEGRATOR re-run, until the integration is satisfactory across the sequence. Individual peak boundaries can also be corrected per sample by editing RT_matrix.csv and re-running only step 3 — re-running step 2 overwrites these manual edits.
Hit a problem? The FAQ & Troubleshooting page covers the most frequent failure modes — a misread CSV, an unmatched transition, a zero area, or MRMhub-viz not loading.
6. Integration results
INTEGRATOR writes the integration results as different tables to the project folder:
quant_raw.csv(wide format) — a features × samples matrix of peak areas only, with the precursor and product m/z and the expected RT (fromfeature_list.csv) carried in the top rows.long.csv(long format) — one row per sample × feature, with area, height, FWHM, and apex RT , and transition m/z, acquisition timestamp, and metadata from the input files.RT_matrix.csv— the peak boundaries per feature and sample, produced in step 2. These can be edited to adjust individual peaks (see Review the results).
See Processing Workflow for the full definition of these file formats.
7. Post-processing
One recommended route is MRMhub QUANT, the post-processing module of MRMhub. This R package imports INTEGRATOR’s long.csv directly for normalisation, drift and batch correction, calibration, quality control, and reporting:
mrmhub::import_data_mrmhub(path = "path/to/long.csv", import_metadata = TRUE)