Processing Workflow
INTEGRATOR processes a prepared analysis project in four steps, using a terminal menu. Steps 1–3 run in sequence — data validation, peak detection with RT-shift estimation, and peak integration — producing the integrated results, and step 4 optionally renders chromatogram PDFs. The integration can be reviewed via the PDFs or in MRMhub-viz (after step 3) and refined iteratively. Refinement typically proceeds from global (param.txt) to feature-level (feature_list.csv) parameters, re-running the full workflow. Individual peaks can also be adjusted — a manual integration — by editing RT_matrix.csv and re-running step 3.
The four processing steps, the review, and the two refinement paths.
Setting up an INTEGRATOR project
A project with executables, mzML files, and the input files is assembled as detailed in Installation and Input Files. Before launching the integration, confirm:
- Every mzML file is listed in the sample list, named exactly (
.mzML, case-sensitive). - The CSV files include the required column headers, named exactly, with all required columns filled.
- Precursor/product m/z fall within
mz_tol; RT in minutes. referencesamples are defined in therun_order.csv.
INTEGRATOR integrates only transitions present in all mzML files and listed in feature_list.csv. Transitions missing from even one file are dropped for the whole dataset (reported in missing_compounds.txt / missing_details.txt).
Launching INTEGRATOR
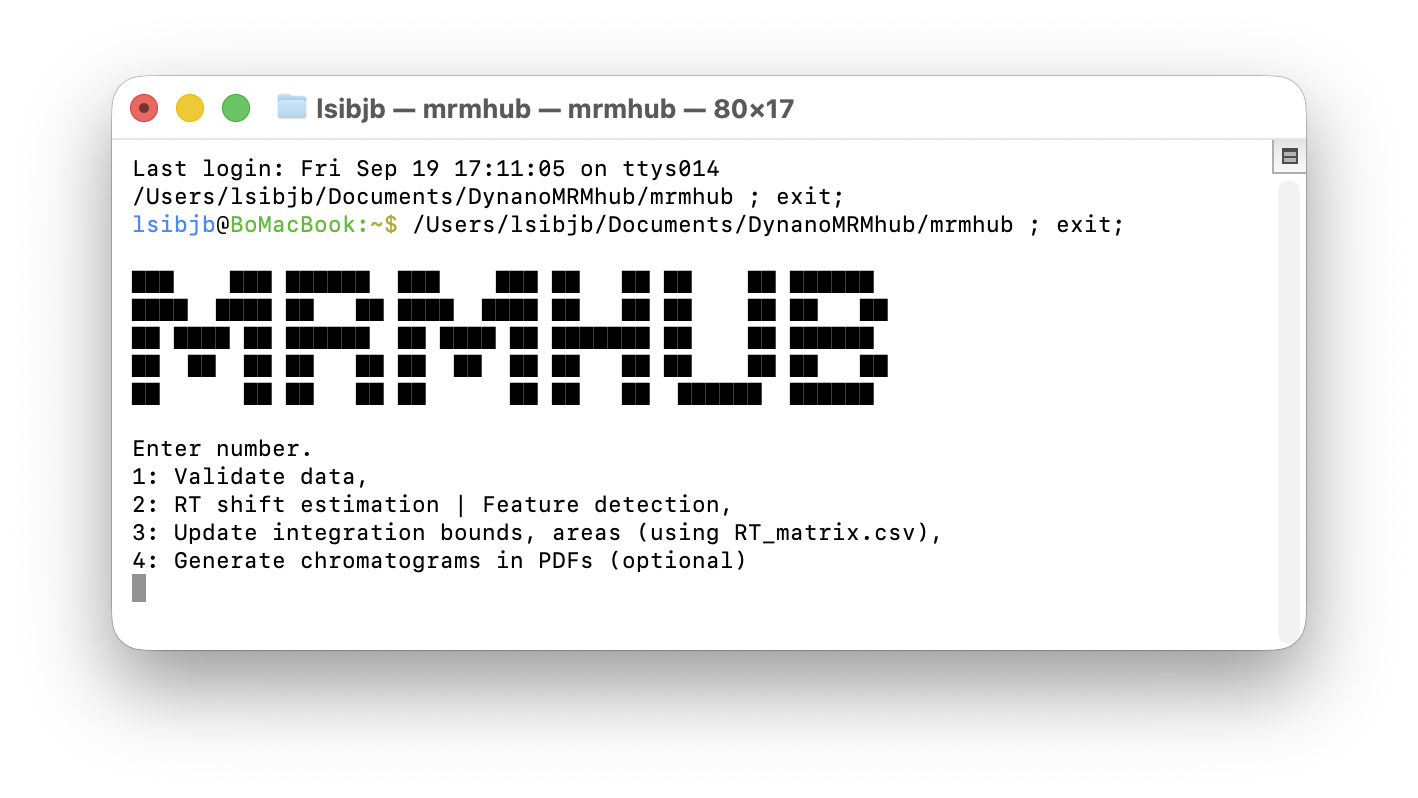
INTEGRATOR is started from the project folder by double-clicking MRMhub (macOS) or MRMhub.exe (Windows), or by running it from a terminal opened there. A four-item menu is presented; for a new dataset steps 1–3 are run in order, and step 4 is optional.
Step 1 — Data validation
The input files are validated against the mzML files. Report files are written in case mismatches are found:
missing_files.txt— mzML files present in the data folder but not listed in therun_order.csv, or listed but absent from the mzML folder.missing_compounds.txt— transitions listed infeature_list.csvnot found in all of the mzML files.missing_details.txt— for each such transition, the specific samples in which it is absent.
Step 2 — Peak detection and RT-shift estimation
The peak-detection and picking algorithm is run, producing a matrix of the detected peaks with their per-sample integration borders, stored in RT_matrix.csv.
Step 3 — Peak integration
In this step, detected peaks (as defined in RT_matrix.csv) are integrated. The integration results are written to the project folder:
long.csv— long format, one row per sample × feature: area, height, apex RT, and FWHM, with precursor and product m/z values, and acquisition timestamps.quant_raw.csv— wide-format table with peak areas. Precursor and product m/z values and the expected RT (fromfeature_list.csv) are included in the first three rows.misc/— binary result files, used in step 4 and by MRMhub-viz.
See Output Files for more details on the format of these result files. The integrated chromatograms with peak-integration results can now be reviewed using MRMhub-viz (see Review of results) and refined along two paths (see Integration refinement below).
Step 4 — Chromatogram PDF generation (optional)
Chromatograms with integration results are plotted as PDFs in three folders. Note that this step may take time for large projects even with multithreading active (default).
by_transition/— one PDF per transition, except low-intensity peaks (see next).by_transition_low/— as above, but transitions with peak areas below a threshold (set inMRMhub_plot.r).by_sample/— one PDF per reference sample, with all its integrated transitions.
Review of results
Integration results are reviewed in either of two ways:
- PDFs (if step 4 was run) — browsed with a file previewer: macOS Quick Look (Space) or the Windows preview pane, switching transitions with the arrow keys.
- MRMhub-viz — interactive, per-transition chromatogram review, available after step 3.
Integration refinement
To refine or adjust peak picking and integration, typically first the global, then the per-feature, integration parameters are optimised in an iterative process (see the flowchart at the top). Always re-run the full workflow (steps 1, 2, and 3) to apply the changes to the input files. See Tuning Peak Integration for details.
- Global refinement — adjust the global parameters in
param.txt, in particularRT_shift,RT_tol, andpeak_width. - Per-feature refinement — adjust the feature-specific integration parameters in
feature_list.csv(e.g.,peak_width,uniform_width, and fixed peak boundaries).
Additionally, the user has the option to manually adjust the peak integration borders of individual peaks by updating the peak border values in the RT_matrix.csv file. This may be useful where no parameter choice leads to satisfactory integration results, or for specific complex chromatograms. Step 3 must be re-run to incorporate these updated borders (do not re-run Step 2 — see the warning below).
RT_matrix.csv
Make a backup of RT_matrix.csv before re-running Step 2 if you have manually edited it, as step 2 overwrites all manual edits!
Post-processing of integration results
One recommended route is MRMhub QUANT, the postprocessing module of MRMhub. This R package offers functions for normalisation, drift/batch correction, quality control, reporting, and more. Results are imported as:
mrmhub::import_data_mrmhub(path = "path/to/long.csv", import_metadata = TRUE)See also
- Output Files — the full format of every file produced here.
- Tuning Peak Integration — choosing parameters for difficult peaks.
- MRMhub-viz — inspect peaks and guide refinement.
- Sharing & Archiving — bundle data and parameters for reproducibility.