Tuning Peak Integration
The parameters defined in param.txt and the transition/feature list govern how INTEGRATOR detects and bounds peaks. This page describes how each setting behaves and how to choose values for difficult chromatograms. For the field-by-field syntax and defaults see Input Files; for the underlying method see the Algorithm. Confirm the effect of any change visually in MRMhub-viz before re-integrating the whole dataset.
Effects of the key settings
Settings apply at two levels: global parameters in param.txt, and per-feature overrides in the transition list (feature_list.csv). A single global configuration should suit the majority of peaks; per-feature overrides then correct the problematic minority, and a well-chosen global peak_width minimises how many are needed.
Global parameters (param.txt)
Most settings trade sensitivity (finding and fully capturing the intended peak) against specificity (not grabbing a neighbouring transition, an adjacent peak, or noise). The table summarises the behaviour at each extreme; peak_width, the most influential setting for difficult chromatograms, is detailed below.
| Setting | What it controls | Too small/narrow | Too large/wide |
|---|---|---|---|
mz_tol |
How far the detected m/z may deviate from the transition-list value | A transition may not be matched at all if the instrument’s m/z calibration is slightly off | A nearby transition / channel may be matched by mistake |
RT_tol |
The retention-time window searched around the expected RT (key for complex chromatograms) | The peak is missed when its RT drifts beyond the window | A wrong, co-eluting, or adjacent peak may be selected instead of the intended one |
peak_width [w,x,y,z] |
Allowed windows for the left (w–x) and right (y–z) peak borders, relative to the apex | Incomplete integration — tailing or broadened peaks are cut short | Smaller adjacent/interfering peaks are co-integrated into the area |
RT_shift [x,y] |
The maximum RT drift expected across the reference samples | Genuine drift between references is not accommodated, degrading peak tracking | The search window is unnecessarily wide, raising the chance of picking the wrong peak |
RT_shift_bound |
The maximum RT drift allowed between adjacent samples | A real run-to-run RT jump can break sample-to-sample tracking | Spurious jumps may be followed, tracking drift that is not present |
num_threads |
CPU threads used for integration | Slower processing only — no effect on results | Faster, bounded by available cores — no effect on results |
A non-zero RT_shift window is recommended even for methods with negligible drift. RT alignment improves consistent border finding and the resolution of overlapping peaks, whether or not a visible retention-time shift is present. [0, 0] disables it; a small window such as [-0.1, 0.1] is sufficient.
Per-feature settings (feature_list.csv)
Overrides in the transition list correct individual features that the global parameters integrate poorly; see Transition / Feature list for the exact columns and defaults.
| Setting | What it controls | When to apply |
|---|---|---|
peak width |
Per-feature [w, x, y, z], overriding the global peak_width |
Broad, tailing, or interference-prone peaks needing bounds different from the global value |
uniform_width |
Holds the integration width constant across samples | Features integrated correctly in most samples but erratically in a few |
left integration bound / right integration bound |
Fixed peak borders for all samples, defined relative to the reference sample and tracked per sample by RT correction | Peaks no peak_width value integrates consistently — a last resort |
baseline |
Baseline mode: default, v_drop, or v2v |
Peaks on a sloping or elevated baseline |
chromatogram index |
Overrides the automatic chromatogram-to-transition assignment | Transitions matched to the wrong chromatogram |
Setting the peak-width and integration bounds
The peak_width parameter is the most powerful control over peak boundaries in INTEGRATOR, and the single most important setting for reliable automated integration of complex chromatograms. Defined globally in param.txt and optionally overridden per feature in the transition list, it is specified as [w, x, y, z]: the range w–x is the allowed window for the left border and y–z the window for the right border, both measured from the apex (schematic below). The algorithm constrains the peak start and end points to these windows, even where automatic boundary detection would otherwise extend beyond them.
![Schematic of a chromatographic peak illustrating the peak_width [w, x, y, z] parameter. Intensity is on the y-axis and retention time on the x-axis, with the apex marked by a vertical line. Short arrows x and y span the inner windows just left and right of the apex, while wider arrows w and z span the outer windows; the shaded bands mark the allowed ranges for the left border (w to x) and the right border (y to z) relative to the apex.](images/paste-11.png)
The inner offsets x and y set the minimum distance of each border from the apex and are typically left near their defaults (0.05–0.10 min). The outer bounds w and z are the primary adjustment: they cap how far the left and right borders may travel, and so decide whether a tail is fully captured or an adjacent peak is excluded. A tailing peak requires a wide right bound whereas a later-eluting interference requires a narrow one — the same bound pulled in opposite directions — so no single global value serves both, and per-feature overrides are used for the exceptions.
| Chromatogram | Symptom under the global setting | Adjustment |
|---|---|---|
| Tailing peak | The right border is cut short of the tail | Increase the far-right bound z |
| Later-eluting interference | A smaller neighbour is co-integrated on the right | Decrease z so the border stops before it |
| Earlier-eluting interference | Material ahead of the peak is captured on the left | Decrease the far-left bound w |
| Overlapping isomers | The leading isomer is unrecognised; no peak_width value resolves it |
Define fixed integration bounds per feature |
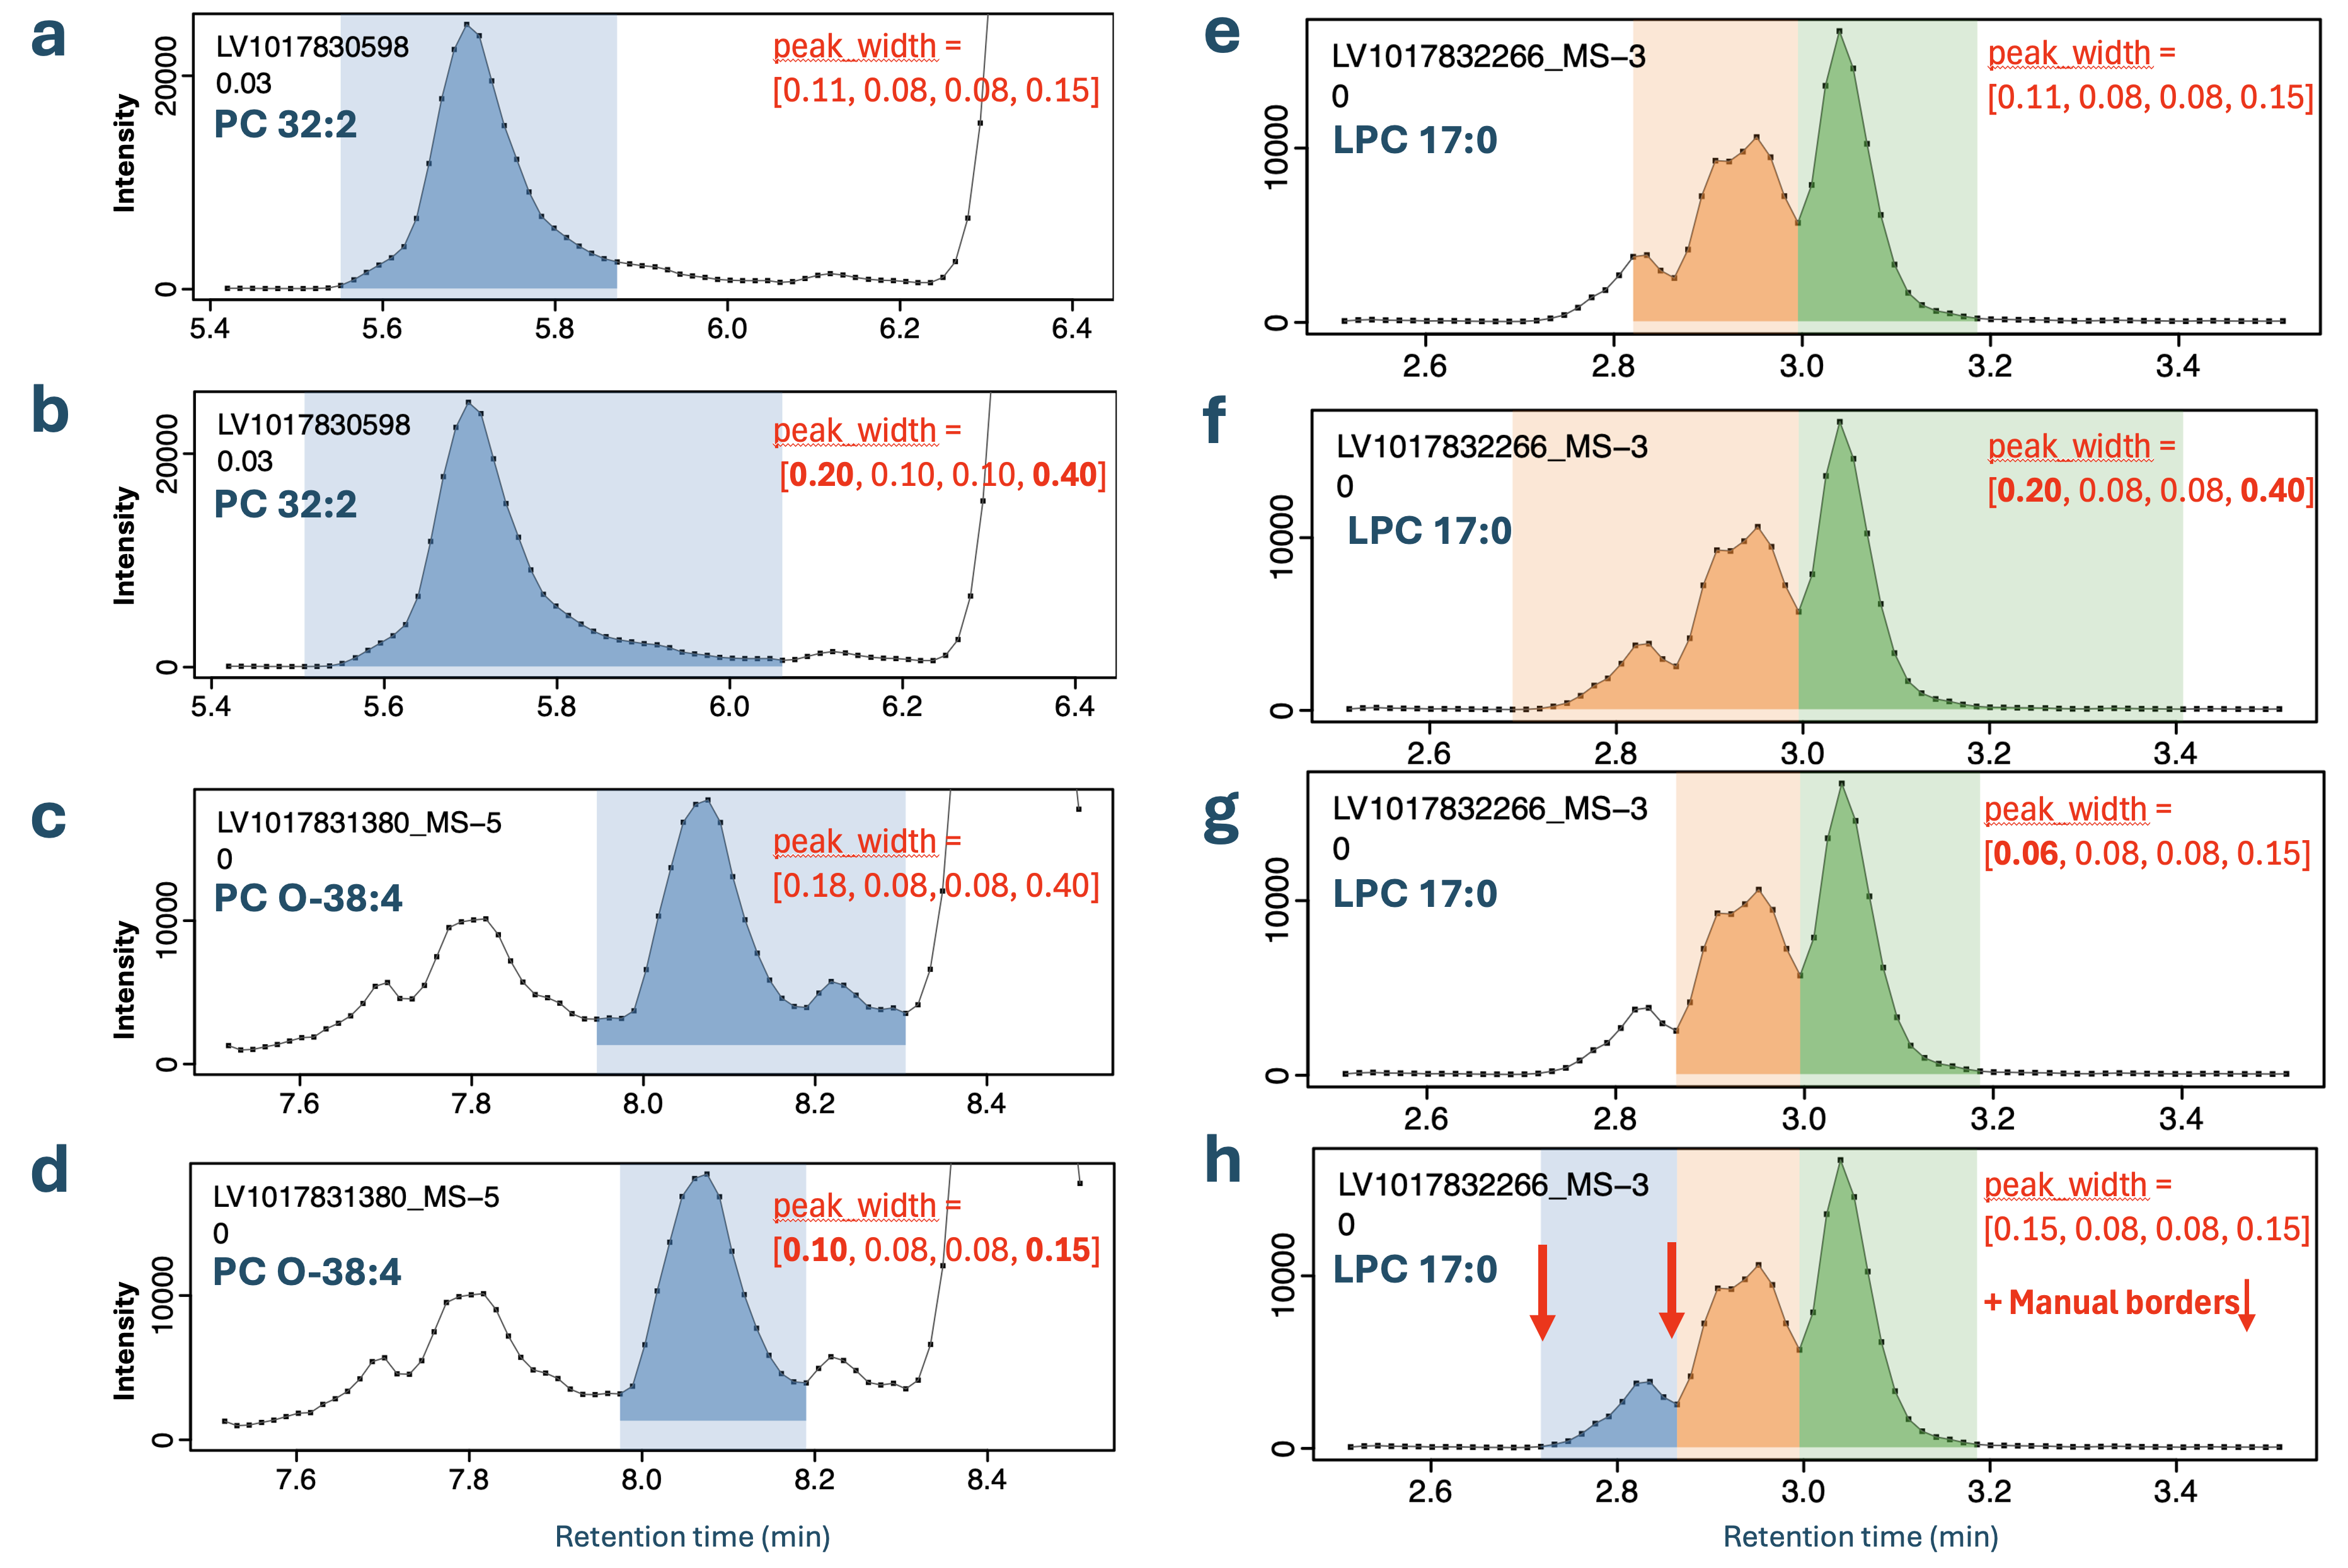
peak_width (shown in red) on three integration problems. (a, b) A tailing peak (PC 32:2): the global setting truncates the tail (a), whereas widening the far-right bound z to 0.40 captures it (b). (c, d) A later-eluting interference (PC O-38:4): a wide z co-integrates the smaller neighbour (c), whereas constraining z to 0.15 excludes it (d) — the same bound a tailing peak needs widened. (e–h) Three overlapping LPC 17:0 isomers: no peak_width setting recovers the leading isomer (e–g), whereas fixed integration bounds defined for it integrate all three correctly (h).
Set uniform_width to y for features whose integration is correct in most samples but inaccurate in a minority: the integration width is then held constant across samples for that transition.
Use fixed left/right integration bounds where automated integration, even after tuning peak_width, does not consistently integrate convoluted peaks or peaks with nearby interferences. Fixed borders are a last resort, since they may require re-adjustment when the same method is applied to other datasets. These borders are still adjusted for retention-time shifts.
The expected RT and fixed left/right integration bounds are interpreted in the retention-time frame of the reference sample(s) and tracked from there into every sample — essential when the sequence drifts. Read these values from a sample marked reference in run_order.csv: a value taken from a drifted non-reference sample carries that offset into the whole sequence, shifting the integration in every sample.
The review → refine loop
Refine iteratively against visual review — in MRMhub-viz or the Step 4 chromatogram PDFs:
| Symptom | Adjust | Re-run |
|---|---|---|
| Missed peak | RT_tol or RT_shift (param.txt) |
Steps 1–3 |
| Co-integrated neighbour | peak_width (param.txt, or per-feature in the transition list) |
Steps 1–3 |
| Untracked RT jump | RT_shift_bound (param.txt) |
Steps 1–3 |
| Individual stubborn peak | integration borders (RT_matrix.csv) |
Step 3 only |
A missed peak may also stem from over-tight settings, a typo in feature_list.csv (m/z or RT), or excessive noise or interference — not from RT_tol / RT_shift alone.
See also
- Input Files — the syntax and defaults of every setting above.
- Peak-detection algorithm — how these settings drive detection and integration.
- MRMhub-viz — inspect integration to guide the review → refine loop.
- Processing Workflow — the four processing steps.