8 My Document
9 Post-processing/QC
9.1 Libraries
9.2 Data Format
The examples below require a tidy (‘long-format’) table with following columns: DataFileName, Feature and Area. See chapters xxxx on how to prepare data in this format. For this chapter we use the example data
# Load and format test data
mydataset_orig <- read_csv(here("data/Testdata_Lipidomics_flat_wide_V3.csv"))

# Convert to long format
mydataset <- mydataset_orig |>
  pivot_longer(-DataFileName, names_to = "Feature", values_to = "Area")
Alternatively, to import a MassHunter CSV file you can use read_MassHunterCSV from the SLINGtools (https://slinghub.github.io/SLINGtools) package
mydataset <- SLINGtools::read_MassHunterCSV(
  file = here("data/Testdata_MHQuant_Detailed_V3.csv"))
9.3 Annotate
d <- mydataset |>
  select(DataFileName, Lipid = Feature, Area) |>
  separate(col = DataFileName,
           into = c("RunID", "QCtype", "SampleName"),
           convert = TRUE,
           sep = "_",
           remove = FALSE) |>
  mutate(SampleName = str_replace(SampleName, ".d", ""))
9.4 RunScatter
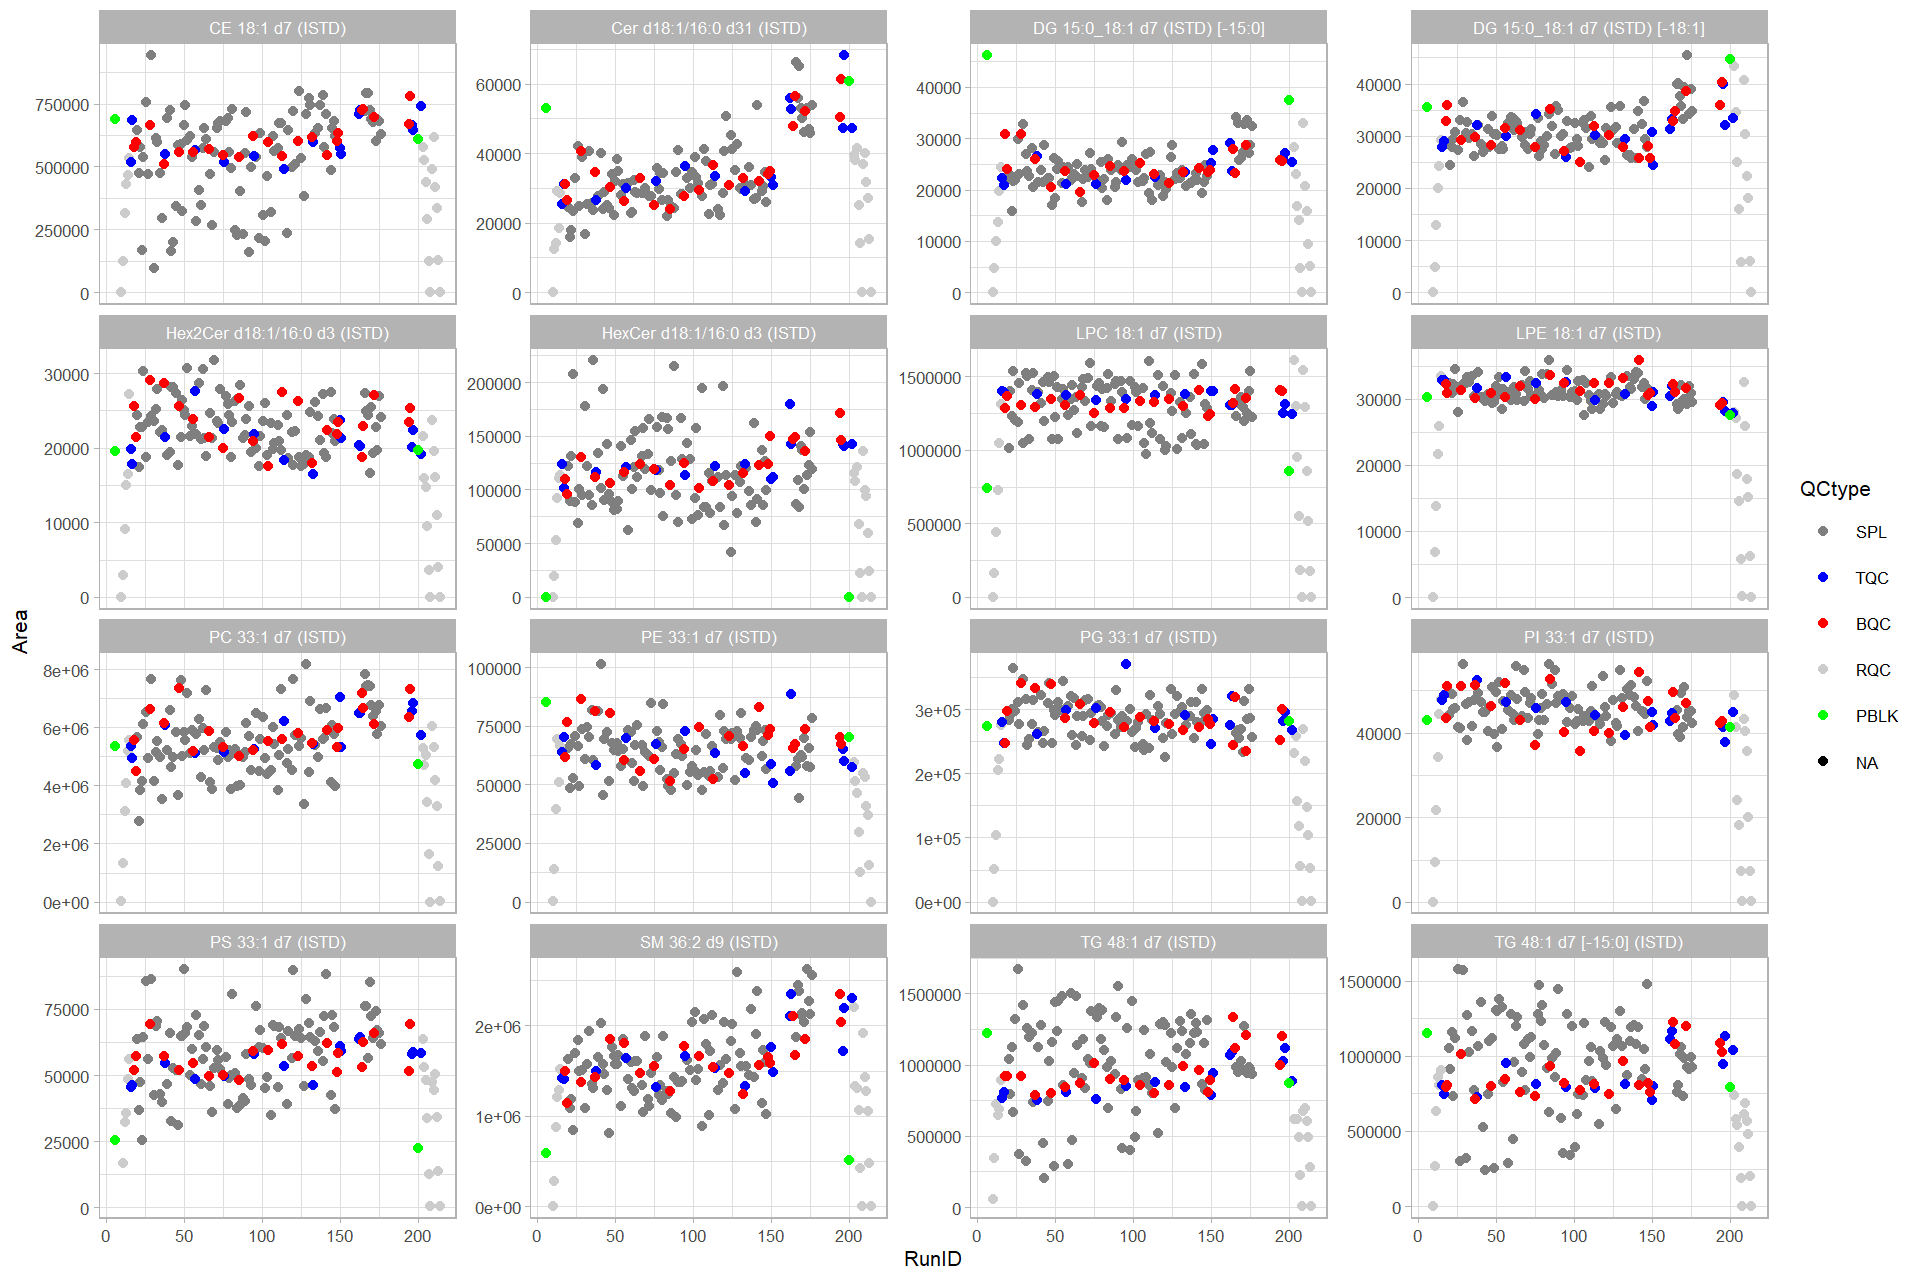
This is for one page (means one plot with n rows and m columns)
d_plot <- d |>
  filter(str_detect(string = Lipid, pattern = fixed("ISTD"))) |>
  filter(QCtype %in% c("SPL", "RQC", "TQC", "BQC", "PBLK"))

d_plot$QCtype <- factor(d_plot$QCtype, levels = c("SPL", "RQC", "TQC", "BQC", "PBLK"))

d_plot <- d_plot |> arrange(QCtype)

qc_colors <- c("SPL"="grey50", "TQC" = "blue", "BQC" = "red",
               "RQC" = "grey80", PBLK="green", "NA" = "black")

ggplot(data = d_plot,
       mapping = aes(x=RunID, y=Area)) +
  geom_point(aes(color = QCtype), size = 1.5) +
  facet_wrap(vars(Lipid), scales = "free_y") +
  scale_color_manual(values = qc_colors ) +
  theme_light(base_size = 8)
#> Warning: Removed 3 rows containing missing values (geom_point).
QCtype_levels_temp <- c( "SBLK", "TBLK", "UBLK", "BQC", "TQC", "RQC", "EQC", "NIST", "LTR", "PBLK", "SPL", "SST", "MBLK")

QCtype_col <-         c("#1854f9","#db0202", "#de21de","#db0202","#1854f9","#96a4ff","#513c3c","#002e6b","#880391","#08c105","#aaaeaf","#bafc03", "black")
names(QCtype_col) <- QCtype_levels_temp


QCtype_shape <- c(23,23,23,16,25,6,24,23,23,23,22,10,10)
names(QCtype_shape) <- QCtype_levels_temp


QCtype_fillcol <- c("#f891ff","#fffb03","#c1bd04","#db0202","#1854f9","#688ff9","NA", "#cce2ff","#880391", "#08c105", "NA","#aaaeaf","black")
names(QCtype_fillcol) <- QCtype_levels_temp


ggplot(data = d_plot,
       mapping = aes(x=RunID, y=Area, color= QCtype , fill= QCtype , shape = QCtype)) +
  geom_point(size = 1.5) +
  facet_wrap(vars(Lipid), scales = "free_y", ncol = 3) +
    expand_limits(y = 0) +
    scale_color_manual(values=QCtype_col, drop=TRUE) +
    scale_fill_manual(values=QCtype_fillcol, drop=TRUE)+
    scale_shape_manual(values=QCtype_shape, drop=TRUE) +
  theme_light(base_size = 8)
#> Warning: Removed 3 rows containing missing values (geom_point).