13 Multivariate Regression
13.1 Libraries
13.2 Import Datasets
13.3 Prepare Data
# Convert to long format
d_long <- d_wide |>
  pivot_longer(cols = -ID, names_to = "Compound" , values_to = "Conc")

# Combine data and metadata
d_full <- d_meta |> left_join(d_long, by = "ID")

# log-transform and scale (z-score) data
d_full <- d_full |>
  group_by(Compound) |>
  mutate(Conc_log = log2(Conc),
         Conc_logz = as.numeric(scale(Conc_log)))
13.4 Run regression for each lipid
In this example a logistic regression is used. The output of glm() is converted to a tidy table using the broom::tidy() function.
model <- as.formula("DM ~ Age + Gender + BMI + HbA1c +
                    SBP + HDL + LDL + TG + Conc_logz")

d_res <- d_full %>%
  group_by(Compound) %>%
  nest() %>%
  mutate(
    models = map(data, function(x) glm(model, data = x, family = "binomial")),
    tidy = map(models, function(x) broom::tidy(x))) |>
  unnest(tidy) |>
  dplyr::select(-data, -models)
The results contain the combined estimates, errors, and P values for each term for each lipid species.
| Compound | term | estimate | std.error | statistic | p.value |
|---|---|---|---|---|---|
| Cer d16:1/16:0 | (Intercept) | -20.955219 | 1.886056 | -11.110601 | 0.000000 |
| Cer d16:1/16:0 | Age | 0.032885 | 0.010896 | 3.017987 | 0.002545 |
| Cer d16:1/16:0 | Gender | 0.593323 | 0.217179 | 2.731950 | 0.006296 |
| Cer d16:1/16:0 | BMI | 0.129663 | 0.027600 | 4.698024 | 0.000003 |
| Cer d16:1/16:0 | HbA1c | 2.041818 | 0.281859 | 7.244102 | 0.000000 |
| Cer d16:1/16:0 | SBP | 0.017569 | 0.005370 | 3.271562 | 0.001070 |
| Cer d16:1/16:0 | HDL | -0.725890 | 0.368385 | -1.970465 | 0.048785 |
| Cer d16:1/16:0 | LDL | -0.247450 | 0.128041 | -1.932579 | 0.053288 |
| Cer d16:1/16:0 | TG | 0.402731 | 0.142030 | 2.835530 | 0.004575 |
| Cer d16:1/16:0 | Conc_logz | 0.197851 | 0.113746 | 1.739413 | 0.081962 |
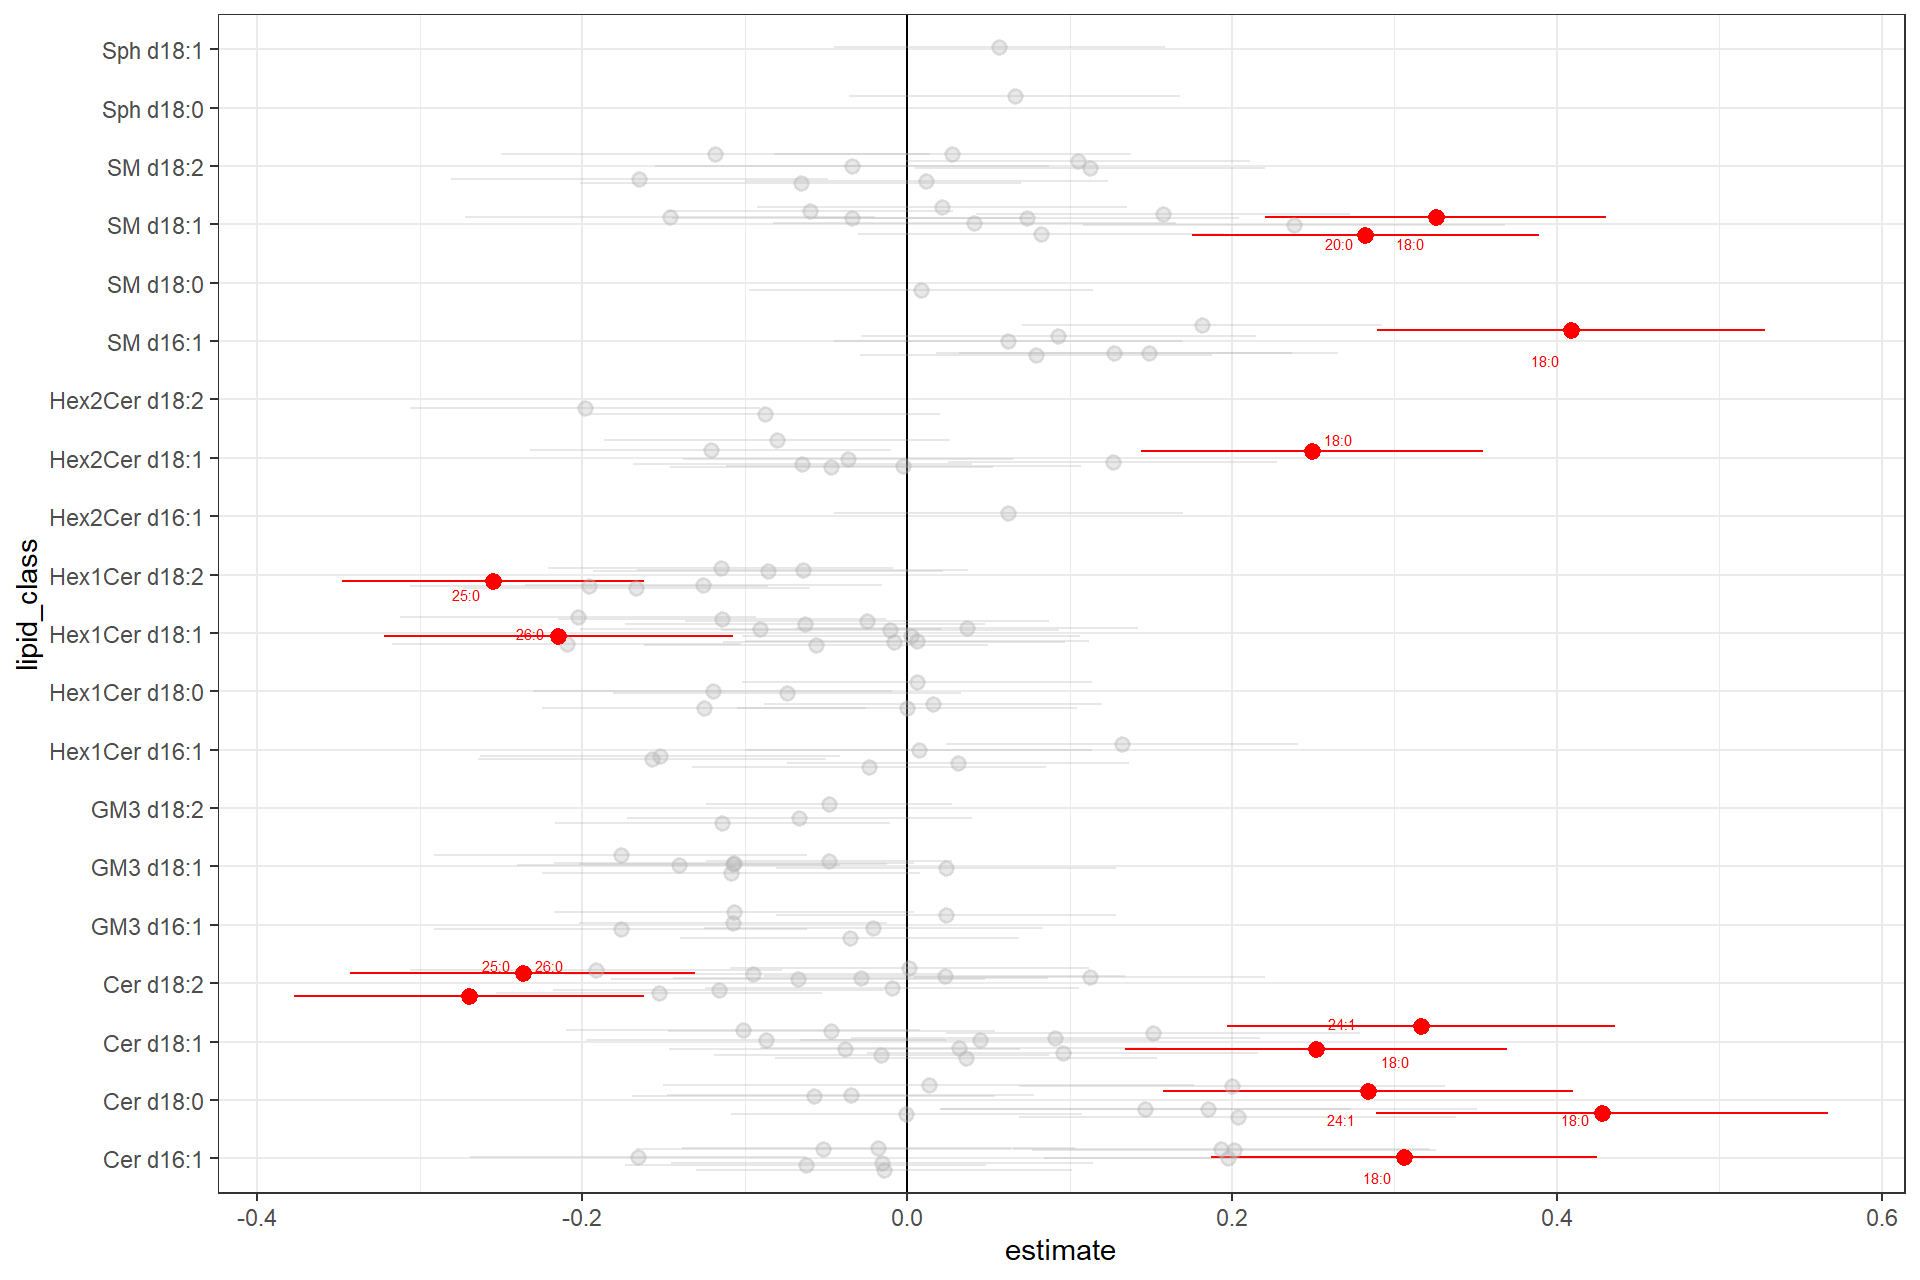
To get the effects and P values for the lipids we filter for the term Conc_logz. We futhermore get the adjusted P values (FDR).
| Compound | term | estimate | std.error | statistic | p.value | FDR |
|---|---|---|---|---|---|---|
| SM d16:1/18:0 | Conc_logz | 0.408832 | 0.119650 | 3.416896 | 0.000633 | 0.000633 |
| SM d18:1/18:0 | Conc_logz | 0.325500 | 0.105045 | 3.098661 | 0.001944 | 0.001944 |
| Cer d18:0/18:0 | Conc_logz | 0.427791 | 0.139298 | 3.071052 | 0.002133 | 0.002133 |
| Hex1Cer d18:2/25:0 | Conc_logz | -0.255110 | 0.092979 | -2.743742 | 0.006074 | 0.006074 |
| Cer d18:1/18:0 | Conc_logz | 0.316480 | 0.119278 | 2.653288 | 0.007971 | 0.007971 |
| SM d18:1/20:0 | Conc_logz | 0.282201 | 0.106676 | 2.645399 | 0.008159 | 0.008159 |
13.5 Forest Plot
Prepare data for the plot: get lipid class from lipid names, join it to the data frame, calculate FDR, get upper/lower errors, and set “significant specie”
# lipid annotation
d_lipid_annot <- d_res_lipids |>
  select(Compound) |>
  separate(Compound,
           into = c("lipid_class", "fa_chain"),
           remove = FALSE,
           extra = "drop",
           fill = "right",
           sep = "/" )

d_plot <- d_res_lipids |>
  full_join(d_lipid_annot, by = "Compound") |>
  mutate(
    est_low = estimate - std.error,
    est_high = estimate + std.error,
    signif = FDR < 0.05,
    label = if_else(signif, fa_chain, "")) |>
  arrange(signif)
Plot estimates of all lipid species, grouped by lipid class, highlighting significant species in red and label them by the FA chain.
ggplot(d_plot, aes(x = lipid_class, y = estimate,color = signif, label = label)) +
  geom_hline(yintercept = 0) +
  geom_pointrange(aes(ymin = est_low, ymax = est_high, alpha = signif),
                  size = 0.5,
                  position = position_jitter(width = .3, height = 0)) +
  coord_flip() +
  scale_color_manual(values = c("FALSE" = "grey70", "TRUE" = "red")) +
  scale_alpha_manual(values = c("FALSE" = 0.3, "TRUE" = 1)) +
  ggrepel::geom_text_repel(
    aes(y = estimate),
    size = 2,
    max.overlaps = 5,
    point.padding = .7
  ) +
  theme_bw() +
  theme(legend.position="none")