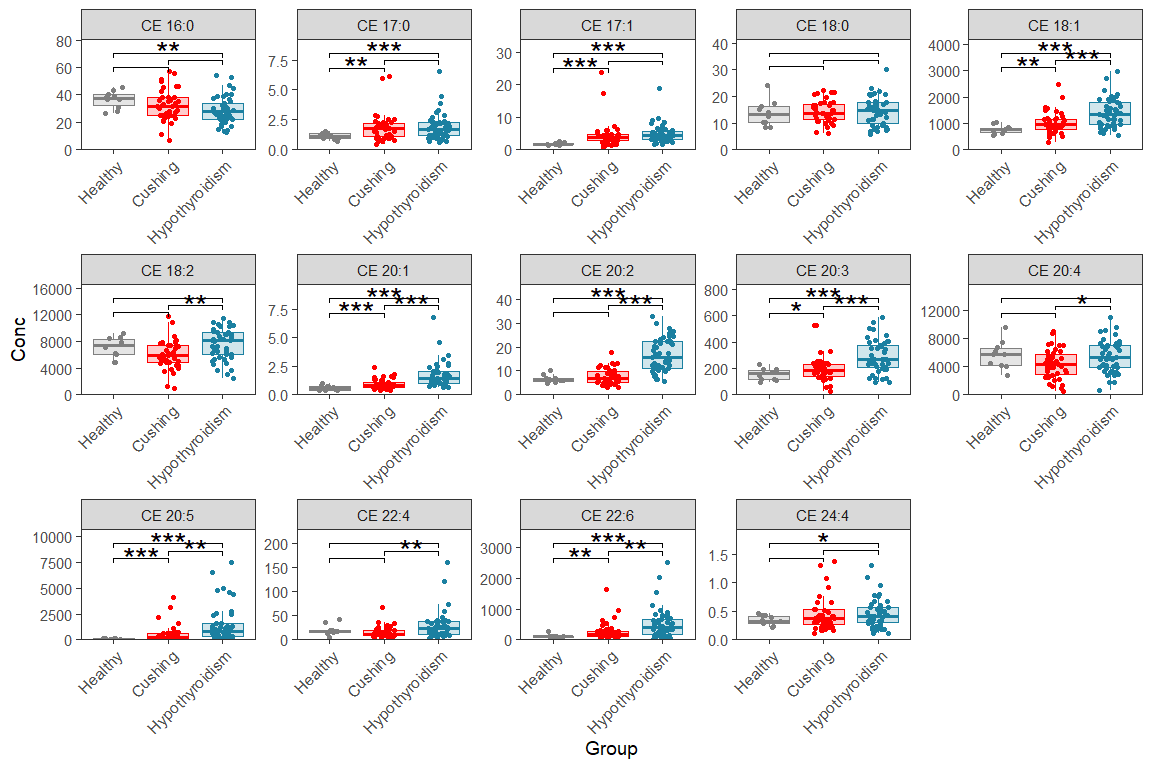
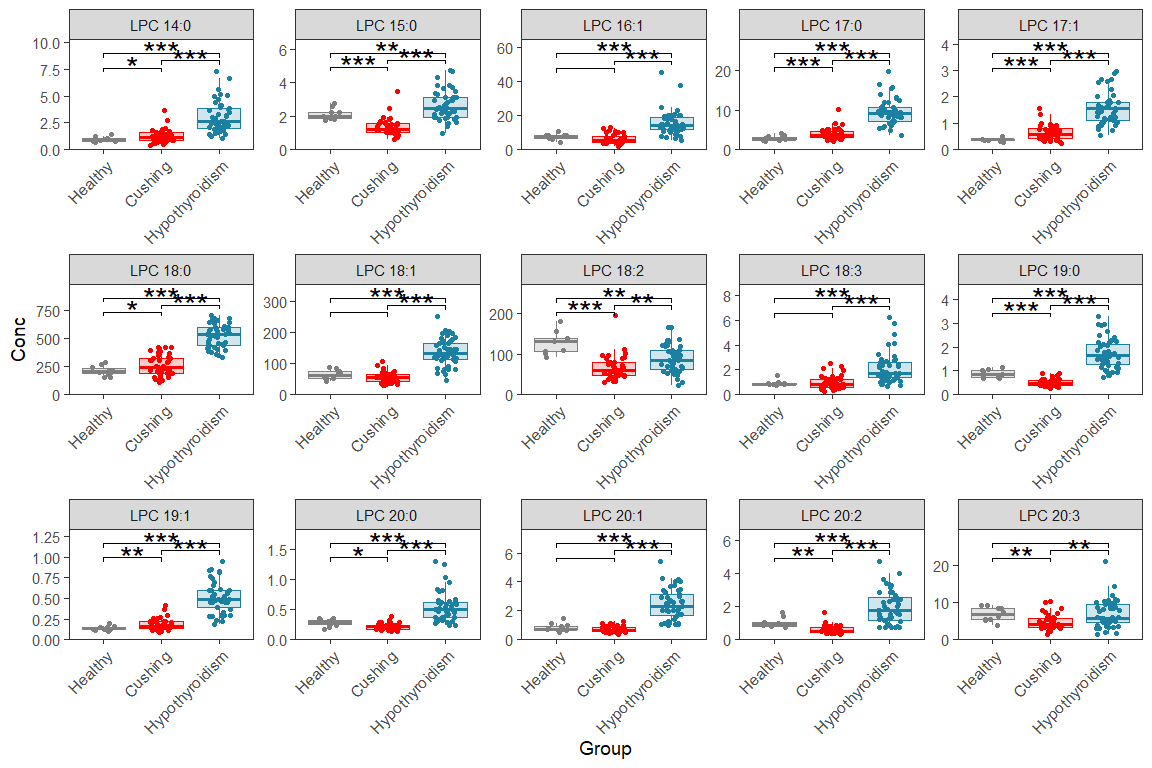
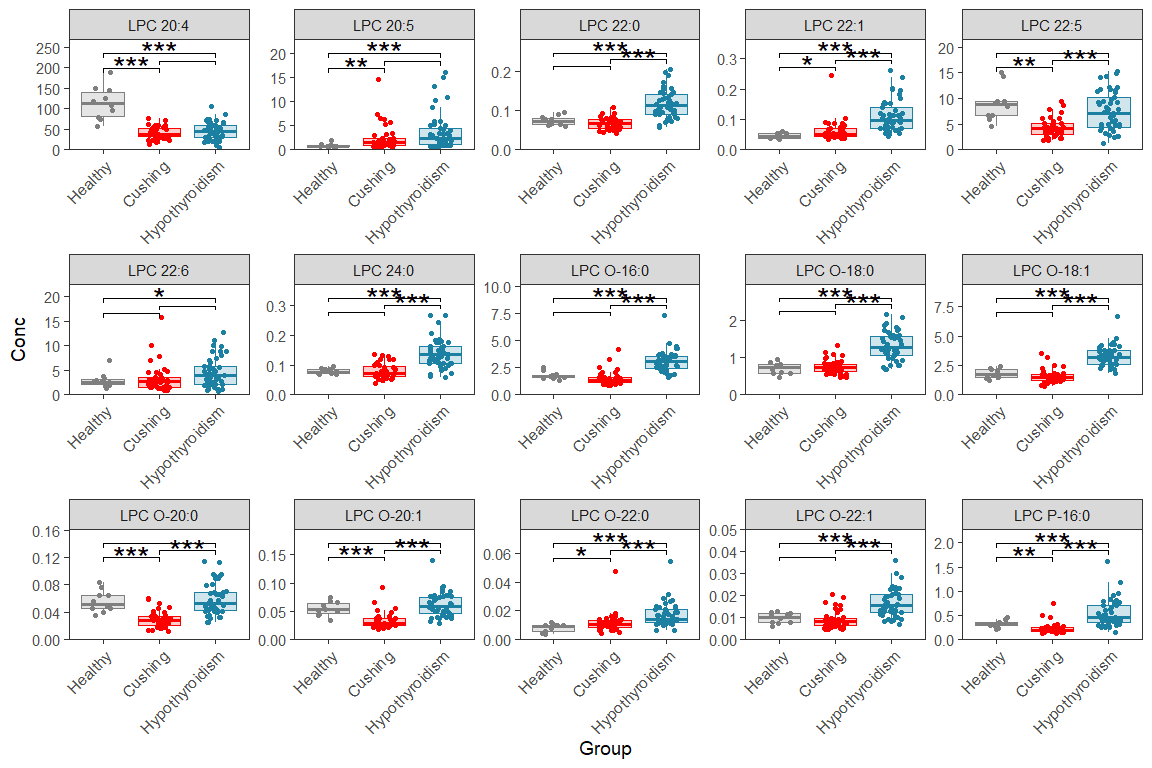
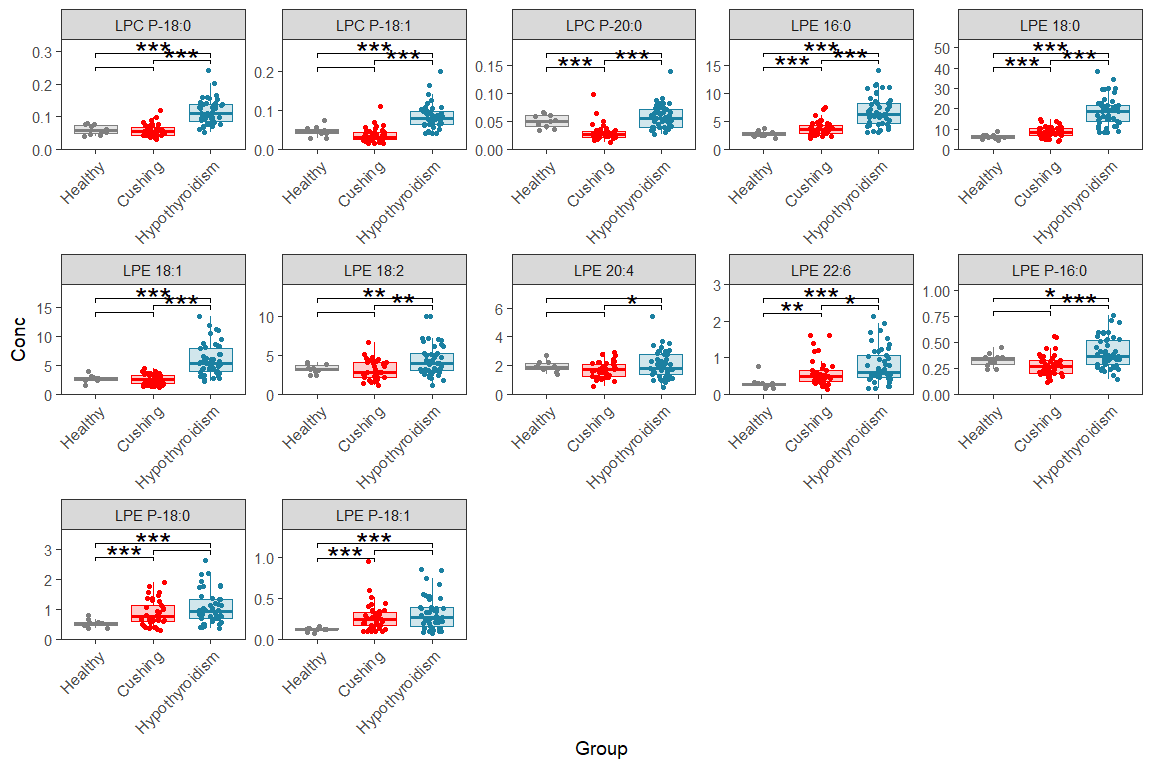
11 Box/dot plots with Contrasts
11.1 Libraries
11.2 Data Format
The examples below require a tidy (‘long-format’) table with following columns: SubjectID, Group, Lipid and Conc. See chapters xxxx on how to prepare data in this format. In this example a test dataset is used that is converted into the tidy format.
# Load and format test data
d_long <- read_csv(here("data/Metabolites-1614644-supplementary.csv")) |>
pivot_longer(cols = -c(SubjectID, Group), names_to = "Lipid", values_to = "Conc")| SubjectID | Group | Lipid | Conc |
|---|---|---|---|
| HB_01 | Healthy | CE 16:0 | 36.82 |
| HB_01 | Healthy | CE 17:0 | 1.02 |
| HB_01 | Healthy | CE 17:1 | 1.34 |
| HB_01 | Healthy | CE 18:0 | 12.34 |
| HB_01 | Healthy | CE 18:1 | 573.83 |
11.3 Single faceted box/dot plot
This is for one page (means one plot with n rows and m columns)
# OPTIONAL: order your groups as you wish (otherwise it will be alphabetical)
d_long$Group <- factor(d_long$Group,
                       levels = c("Healthy", "Cushing", "Hypothyroidism"))

# OPTIONAL: define specific color for each group,
my_colors <- c(Healthy = "grey50", Cushing = "red", Hypothyroidism = "#1b80a1")

# OPTIONAL: Subset your data
d_plot <- d_long |> filter(str_detect(Lipid, "CE"))


# IMPORTANT: Change variable names to match your data (i.e. Group, Conc, Lipid)
# IMPORTANT: Change group names and add/remove comparisons in `ggsignif()`
ggplot(d_plot, aes(x = Group, y = Conc, color = Group,fill = Group)) +
  geom_boxplot(alpha = 0.2, lwd=0.3, outlier.shape = NA) +
  geom_jitter(size = 0.5,width = 0.2) +
  facet_wrap(~Lipid, scales = "free", nrow = 4, ncol = 5) +
  scale_y_continuous(limits = c(0,NA), expand = expansion(mult = c(0, .15)))+
  scale_color_manual(values = my_colors) +
  scale_fill_manual(values = my_colors) +
  ggsignif::geom_signif(
    comparisons = list(
      c("Healthy", "Cushing") ,
      c("Cushing", "Hypothyroidism"),
      c("Healthy", "Hypothyroidism")
    ),
    test = "t.test",
    test.args = list(paired=FALSE, var.equal = FALSE, na.rm = TRUE),
    map_signif_level = c("***"=0.001, "**"=0.01, "*"=0.05, " " = 1),
    margin_top = 0.05, step_increase = 0.1, vjust = 0.5, size = 0.2,
    tip_length = 0.05, textsize = 4, color = "black") +
  theme_bw(base_size = 7) +
  theme(
    axis.text.x = element_text( size=6, angle = 45,vjust = 1, hjust = 1),
    panel.grid = element_blank(),
    legend.position="none"
  )
11.4 Multi-page faceted box/dot plot
Here we make the same plots as before but over multiple pages/figures, like this we can make boxplots for each lipid If you adopt this for your own data, you need to set number of plots per page (number of rows and columns), also you need to update it with your group names and colors.
# Order the groups as you wish (otherwise it will be alphabetical), if you are
d_long$Group <- factor(d_long$Group,
                       levels = c("Healthy", "Cushing", "Hypothyroidism"))

# Define your color for each group,
# can also get colors (e.g. #1b80a1) via e.g. https://g.co/kgs/DQH6Fr
my_colors <- c(Healthy = "grey50", Cushing = "red", Hypothyroidism = "#1b80a1")


# In this example we subet to have 3 pages, remove the filter for all lipids
d_plot <- d_long |> filter(str_detect(Lipid, "LPC|LPE"))

# Define a function to plot one faceted plot (=one page)
plot_one_page <- function(data, n_row, n_col){
  ggplot(data, aes(x = Group, y = Conc, color = Group,fill = Group)) +
    geom_boxplot(alpha = 0.2, lwd=0.3, outlier.shape = NA) +
    geom_jitter(size = 0.5,width = 0.2) +
    facet_wrap(~Lipid, scales = "free", nrow = n_row, ncol = n_col) +
    scale_y_continuous(limits = c(0,NA), expand = expansion(mult = c(0, .15)))+
    scale_color_manual(values = my_colors) +
    scale_fill_manual(values = my_colors) +
    ggsignif::geom_signif(
      comparisons = list(
        c("Healthy", "Cushing") ,
        c("Cushing", "Hypothyroidism"),
        c("Healthy", "Hypothyroidism")
      ),
      test = "t.test",
      test.args = list(paired=FALSE, var.equal = FALSE, na.rm = TRUE),
      map_signif_level = c("***"=0.001, "**"=0.01, "*"=0.05, " " = 1),
      margin_top = 0.05, step_increase = 0.1, vjust = 0.5, size = 0.2,
      tip_length = 0.05, textsize = 4, color = "black") +
    theme_bw(base_size = 7) +
    theme(
      axis.text.x = element_text( size=6, angle = 45,vjust = 1, hjust = 1),
      panel.grid = element_blank(),
      legend.position="none"
    )
}

# Set how many plots per page (number of rows and columns)
rows_page = 3
columns_page = 5

my_plots <- d_plot %>%
  group_by(Lipid) |>
  mutate(page_no = ceiling(cur_group_id()/ (rows_page * columns_page))) |>
  group_by(page_no) %>%
  nest() %>%
  mutate(plt = map(data, ~ plot_one_page(.,n_row = rows_page, n_col = columns_page)))

my_plots$plt

