Plot Curve Summary Numeric Table For One Group
Source:R/dilplots-ggplot.R
plot_summary_table_num.RdPlot curve summary numeric table for one group or batch.
Usage
plot_summary_table_num(
  curve_summary_grp,
  dilution_summary_grp = lifecycle::deprecated()
)
Arguments
- curve_summary_grp
A one row data frame or tibble containing curve summary.
- dilution_summary_grp
![[Deprecated]](figures/lifecycle-deprecated.svg)
dilution_summary_grpwas renamed tocurve_summary_grp.
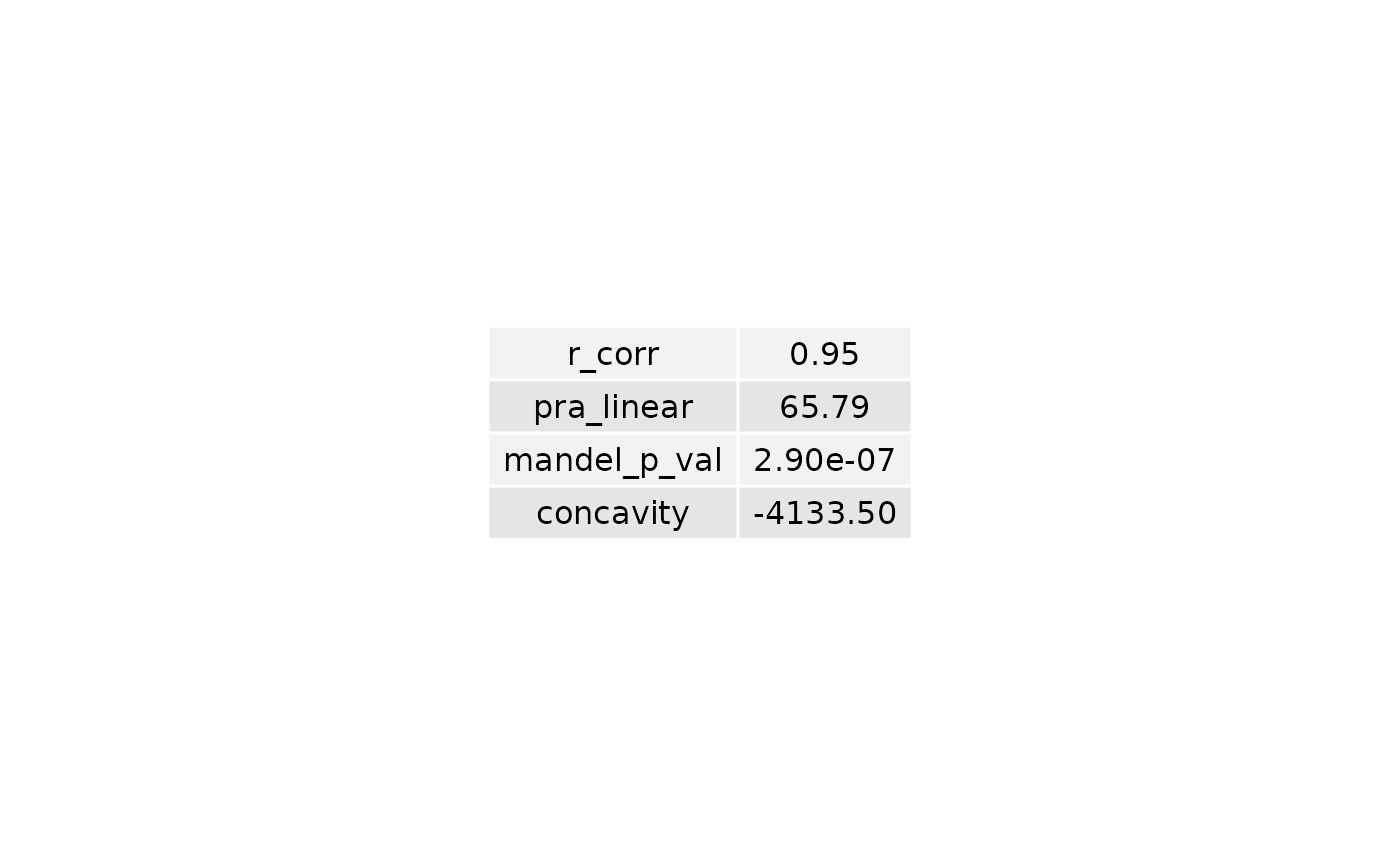
Value
A gridtable object consisting of one table. The first
column is the column names of curve_summary_grp which
are numeric. The second column is their
corresponding values. If there are numeric columns
in curve_summary_grp, NULL will be returned.
Examples
wf1_group <- c("Poor Linearity")

wf2_group <- c("Saturation")

r_corr <- c(0.951956)

pra_linear <- c(65.78711)

mandel_p_val <- c(2.899006e-07)

concavity <- c(-4133.501328)

curve_summary_grp <- data.frame(
  wf1_group = wf1_group,
  wf2_group = wf2_group,
  r_corr = r_corr,
  pra_linear = pra_linear,
  mandel_p_val = mandel_p_val,
  concavity = concavity
)

table <- plot_summary_table_num(curve_summary_grp)

grid::grid.draw(table)


# No numeric column case
curve_summary_grp <- data.frame(wf2_group = wf2_group)

table <- plot_summary_table_num(curve_summary_grp)

table
#> NULL
# No numeric column case
curve_summary_grp <- data.frame(wf2_group = wf2_group)
table <- plot_summary_table_num(curve_summary_grp)
table
#> NULL