Customise Linearity Evaluation Workflow
Source:vignettes/lineval-customization.Rmd
lineval-customization.RmdBy default the function evaluate_linearity will look for
column names r_corr, pra_linear,
mandel_p_val and concavity_column that
represent the Correlation Coefficient, Percent Residual Accuracy and
Mandel’s Fitting Test \(p\) value
respectively.
It is possible to change the column names representing the three
parameters to suit your own dataset using corrcoef_column,
pra_column, mandel_p_val_column and
concavity_column
library(lancer)

curve_name <- c("Curve_1", "Curve_2", "Curve_3", "Curve_4")
corrcoef <- c(0.952, 0.978, 0.971, 0.344)
pra <- c(65.8, 90.2, 72.9, -233)
mandel_pval <- c(0.00000029, 0.290, 0.000000032, 0.0363)
concavity <- c(-4134, -3.35, 0.394, -19.9)

curve_summary <- tibble::tibble(
  Curve_Name = curve_name,
  Corrcoef = corrcoef,
  Pra = pra,
  Mandel_Pval = mandel_pval,
  Concavity = concavity
)
curve_classified <- lancer::evaluate_linearity(
  curve_summary = curve_summary,
  grouping_variable = c(
    "Curve_Name"
  ),
  corrcoef_column = "Corrcoef",
  pra_column = "Pra",
  mandel_p_val_column = "Mandel_Pval",
  concavity_column = "Concavity"
)
print(curve_classified, width = 100)
#> # A tibble: 4 × 7
#>   Curve_Name wf1_group      wf2_group         Corrcoef    Pra Mandel_Pval
#>   <chr>      <chr>          <chr>                <dbl>  <dbl>       <dbl>
#> 1 Curve_1    Poor Linearity Saturation Regime    0.952   65.8 0.00000029
#> 2 Curve_2    Good Linearity Good Linearity       0.978   90.2 0.29
#> 3 Curve_3    Poor Linearity Noise Regime         0.971   72.9 0.000000032
#> 4 Curve_4    Poor Linearity Poor Linearity       0.344 -233   0.0363
#>   Concavity
#>       <dbl>
#> 1 -4134
#> 2    -3.35
#> 3     0.394
#> 4   -19.9
One can change the threshold of the Correlation Coefficient (0.8),
Percent Residual Accuracy (80) and Mandel’s Fitting Test \(p\) value (0.05) using
corrcoef_min_threshold, pra_min_threshold and
mandel_p_val_threshold respectively.
curve_classified <- lancer::evaluate_linearity(
  curve_summary = curve_summary,
  grouping_variable = c(
    "Curve_Name"
  ),
  corrcoef_column = "Corrcoef",
  corrcoef_min_threshold = 0.7,
  pra_column = "Pra",
  pra_min_threshold = 70,
  mandel_p_val_column = "Mandel_Pval",
  mandel_p_val_threshold = 0.01,
  concavity_column = "Concavity"
)
print(curve_classified, width = 100)
#> # A tibble: 4 × 7
#> Curve_Name wf1_group wf2_group Corrcoef Pra Mandel_Pval
#> <chr> <chr> <chr> <dbl> <dbl> <dbl>
#> 1 Curve_1 Poor Linearity Saturation Regime 0.952 65.8 0.00000029
#> 2 Curve_2 Good Linearity Good Linearity 0.978 90.2 0.29
#> 3 Curve_3 Good Linearity Good Linearity 0.971 72.9 0.000000032
#> 4 Curve_4 Poor Linearity Poor Linearity 0.344 -233 0.0363
#> Concavity
#> <dbl>
#> 1 -4134
#> 2 -3.35
#> 3 0.394
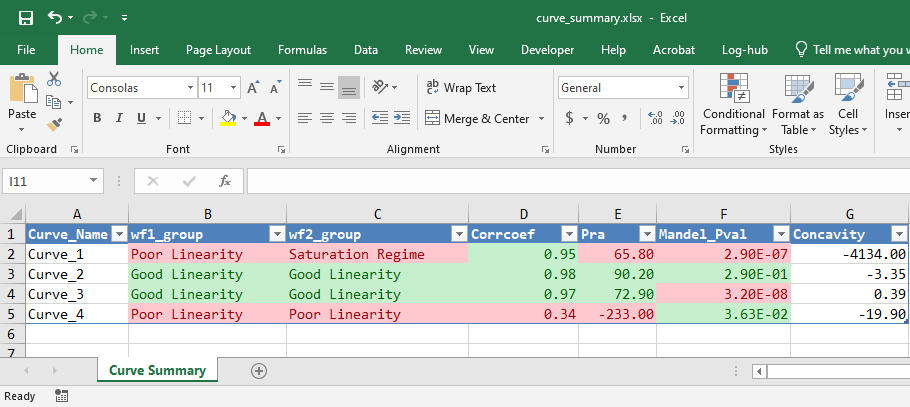
#> 4 -19.9Likewise for the excel output using the function
write_summary_excel, we can choose which column to be
Correlation Coefficient, Percent Residual Accuracy and Mandel’s Fitting
Test \(p\) value, as well as its
threshold value. The sheet name can also be changed.
lancer::write_summary_excel(
  curve_summary = curve_classified,
  file_name = "curve_summary.xlsx",
  sheet_name = "Curve Summary",
  corrcoef_column = "Corrcoef",
  corrcoef_min_threshold = 0.7,
  pra_column = "Pra",
  pra_min_threshold = 70,
  mandel_p_val_column = "Mandel_Pval",
  mandel_p_val_threshold = 0.01,
  workflow1_column = "wf1_group",
  workflow2_column = "wf2_group",
  pass_criteria_words = c("Good Linearity")
)